Covariance and binomial models
I.B.1. Introduction
In both C57BL/6J (B6) and BALB/cByJ (BALB) mice, donor and genetically distinguishable competitor hematopoietic stem cell (HSCs) differentiate into both myeloid and lymphoid lineages. Proportions of differentiated cells from the donor vs. competitor are highly correlated across cell lineages, suggesting that the differentiated cells are descendants of the same HSC clones. For example, lymphocyte:erythrocyte (L:E) correlations usually have r = 0.8 to 0.9 (Table I.2). Within each recipient, the proportion of donor type blood cells remains stable after 3–4 months, showing clonal stability; if HSC clones were transient instead, the proportion of differentiated blood cells from the donor would vary over time.
Proportions of donor-derived lymphocytes and erythrocytes correlate well between 6 and 9 months after transplantation, with r values ranging from r = 0.72 to 0.93 (Table I.2; Harrison et al., 1988, 1989, 1990; Chen et al., 1999, 2003; Yuan et al., 2005). Correlations of the proportion of donor-type cells between various classes of differentiated cells suggest that the same precursors contribute equally to each lineage. Correlations between independent samples taken at different times after transplantation suggest that the same precursors contribute equally over long time periods, a vital measure of clonal stability. Any 2 classes of differentiated cells may be compared the same way we compared erythrocytes and lymphocytes in the following material (Harrison and Zhong, 1992).
Table I.2. Correlations and PHSC concentrations over a 40-fold range of marrow doses.
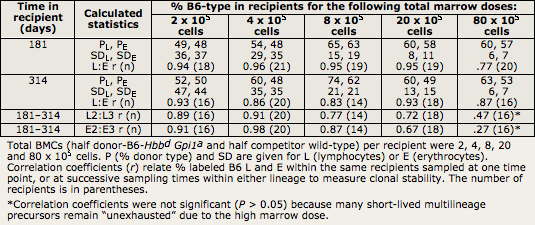
For example, in Table I.2, high L:E correlations within each recipient indicate that erythroid and lymphoid cell types are produced proportionally. Thus, each precursor must receive proportional stimuli for each cell type. Because stimuli are not homogeneous, we suggest that, after transplantation, each HSC produces a constant fraction of multilineage descendants that repopulate each differentiating cell compartment. This fraction is determined by the competition among all HSCs originally transplanted. Furthermore, high correlations between 181 and 314 days (L2:L3 or E2:E3 in Table I.2) show that the proportion of differentiated cells from each donor in each recipient is constant over time: The differentiated cells are produced by the same HSCs that remain active in each recipient, showing clonal stability.
I.B.2. Details of the binomial model
For each individual in a group numbering "n" recipients getting identical portions from the same marrow cell pool, we measure the donor percentages for lymphocytes (PL) and for erythrocytes (PE) at the same sampling time after transplantation. Other classes of cells can be substituted for erythrocytes or lymphocytes for correlation testing. We calculate as follows:
| Mean = | the average of all 2n percentages, which is the average of the 2 sample means estimating PL and PT |
| SDL, SDE = | the standard deviations of the 2 sets of "n" measurements |
| r = | lymphocyte:erythrocyte Pearson correlation coeffecient (L:E r) |
| Covariance = | r x SDL x SDE |
Estimates of precursor number and concentration are calculated from the binomial formula as in equations (1) and (2) below. If, in each individual, there were just N such precursors that contributed equal fractions (1/N of lymphocytes and of erythrocytes), then Equivalent Precursor Number would be an estimate of N, and Equivalent Precursor Concentration would be an estimate of the concentration of such precursors. This is assumed in Table I.2 (above).
(1) Equivalent Precursor Number = (Mean) (100 - Mean ) / Covariance
(2) Equivalent Precursor Concentration = Equivalent Precursor Number / Number of injected cells
The reciprocal of Equivalent Precursor Number is an estimate of the parameter introduced by Stone and Harrison (1990) and labeled pc. If the genetic marking (donor or not) does not affect clonal development, as should be the case using congenic lines, pc is the probability that a randomly picked lymphocyte and a randomly picked erythrocyte are descended from the same transplanted precursor. Even when the assumption that each precursor contributes equally is unrealistic, Equivalent Precursor Number and Equivalent Precursor Concentration have useful interpretations in terms of the fundamental probability parameter pc. They should then be regarded as experimentally ascertainable, inverse measures of the common clonality of the lymphocyte and erythrocyte compartments. Furthermore, if each precursor does not contribute equally, estimates of the Equivalent Precursor Number and Equivalent Precursor Concentration reflect those precursors contributing the most, which usually are the most important and interesting precursors.
I.B.3. Estimates of common, continuously functioning precursors
If the 2 measurements are donor percentages of lymphocytes, erythrocytes, or of another cell class all tested at different sampling times, estimates of common continuously functioning precursors can be made using the methods described in the preceding paragraphs, as illustrated in Table I.2. As long as the sampling times are far enough apart so that sampled cells have been renewed during that interval, estimations of common continuously functioning precursors are valid. In these cases, "r" is the correlation coefficient relating the measures on the same recipients at the 2 times; SD1 and SD2, the standard deviations of measurements at those times, are substituted for SDL and SDE.
Numbers of HSCs in BALB and B6 mice are the same, about 1 per 100,000 BMCs. They are estimated from variances using the binomial or Poisson (competitive dilution) models. Both models estimate number of stem cells based on variance. The distribution of HSCs in each recipient may be considered a random sample of a donor/competitor HSC mixture. If each sample contains many HSCs, e.g. 100, each will represent the pool fairly well, and there will be little variation among samples. However, if each sample contains few HSCs, many samples will contain all or mostly donor or competitor type, and variance among samples will be high, as shown in Figure I.5.
Our group has used covariance techniques to estimate numbers of HSCs in B6 mice using the binomial model (illustrated in Figure I.5 above; Harrison et al., 1989, 1990, 1993), and in both B6 and BALB mice using competitive dilution and the Poisson model (detailed in separate text; Zhong et al., 1996; Chen et al., 1999). BMC donors of both strains have an HSC concentration of 1 per 100,000 BMCs. This concentration of HSCs is constant through a range of 2–80 x 105 BMCs in B6 mice, as illustrated in Figure I.5 above.
BALB donors, like B6, have 1 HSC per 100,000 BMCs in vivo (Chen et al., 1999). This contradicts measures in vitro, where Long Term Colony-Initiating Cell (LTC-IC) numbers were about 4-fold lower in B6 than in BALB, as determined by collaborator Müller-Sieburg (Chen et al., 2000b). Five-week LTC-IC concentrations, given as mean (95% confidence limits), were 7.4 (5.6–9.8) per 105 BMCs for BALB and 1.8 (1.0–3.2) per 105 BMCs for B6, confirming previous estimates by Müller-Sieburg and Riblet (1996).
I.B.4. Strong correlations among differentiated cell types 3 weeks and later post transplantation: indicators that most are descended proportionally from the same precursors
Our multilineage assays in vivo tested whether T and B lymphocytes, or G and M (granulocytes and macrophages) myelocytes, are descended from independent lymphoid-specific or myeloid-specific precursors. Surprisingly, as early as 3 weeks after transplantation, correlations both between and within lymphoid (T or B lymphocytes) and myeloid (granulocytes [G] or macrophages [M]) cells were equally strong.
No significant correlations were observed at 1, 2, or 2.5 weeks after transplantation. The prediction that correlations should be higher between T:B or G:M than between other combinations was not true at the earliest time when any correlations were observed, 3 weeks after transplantation and later. In 4 large studies, strong correlations were seen among all 4 lineages by 3 weeks and later; correlations were no higher between T:B or G:M (or G:platelets) than between any other combinations (Harrison and Zhong, 1992).
Table I.3 provides the high correlations presented in this paper. Precursor concentrations (given in parentheses following the correlation coefficients) were estimated as inversely proportional to covariances using the binomial formula, where N = (Mean)(100 - Mean) / Covariance, and Covariance is the correlation coefficient between population 1 and 2 x standard deviation of 1 (SD1) x (SD2).
Table I.3. Myeloid/lymphoid correlations, 3Ð12 weeks post transplantation.
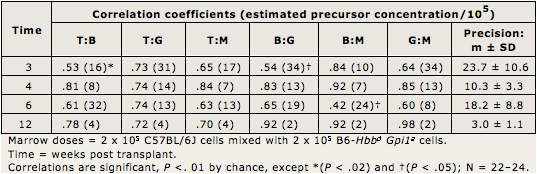
Precursor concentrations in Table I.3 are given in parentheses following the correlation coefficients. They are averaged at the far right (Precision: m ± SD). Concentrations decreased from averages of about 17 after 3–6 weeks to about 3 after 12 weeks post transplantation. Thus, most initial multilineage precursors became exhausted by 12 weeks. By 24 weeks and later, precursor concentrations (not shown) are about 1 per 100,000 marrow cells, as in Figure I.5 and as reported (Harrison et al., 1988; Zhong and Harrison, 1996; Chen et al., 1999).